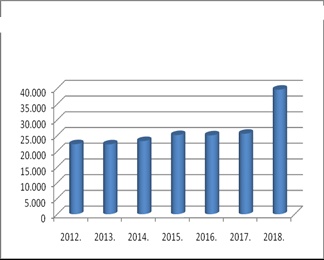
A graphical representation represents the continuous increase in the number of employed persons in the Municipality Novi Grad Sarajevo.
The example was carried on the basis of the indicators for January, in the period of 2012-2018., according to data taken from the Bulletin of the Federal Office of Statistics.